On this page
- What is engineering stress and strain?
- What is true stress and strain?
- What is the necking correction for true stress?
- When should I use engineering stress instead of true stress?
- How do engineering stress-strain and true stress-strain compare?
- How do you calculate true stress from tensile test data?
- What standards apply to engineering and true stress testing?
- How do I prepare true stress-strain data for FEA input?
- What are common misconceptions about engineering vs true stress?
- Key takeaways
Engineering Stress vs True Stress: When to Use Each
Engineering stress vs true stress explained with formulas, necking correction and a side-by-side comparison table. Covers when to use each for FEA, forming simulations and ASTM E8/E646 compliance.
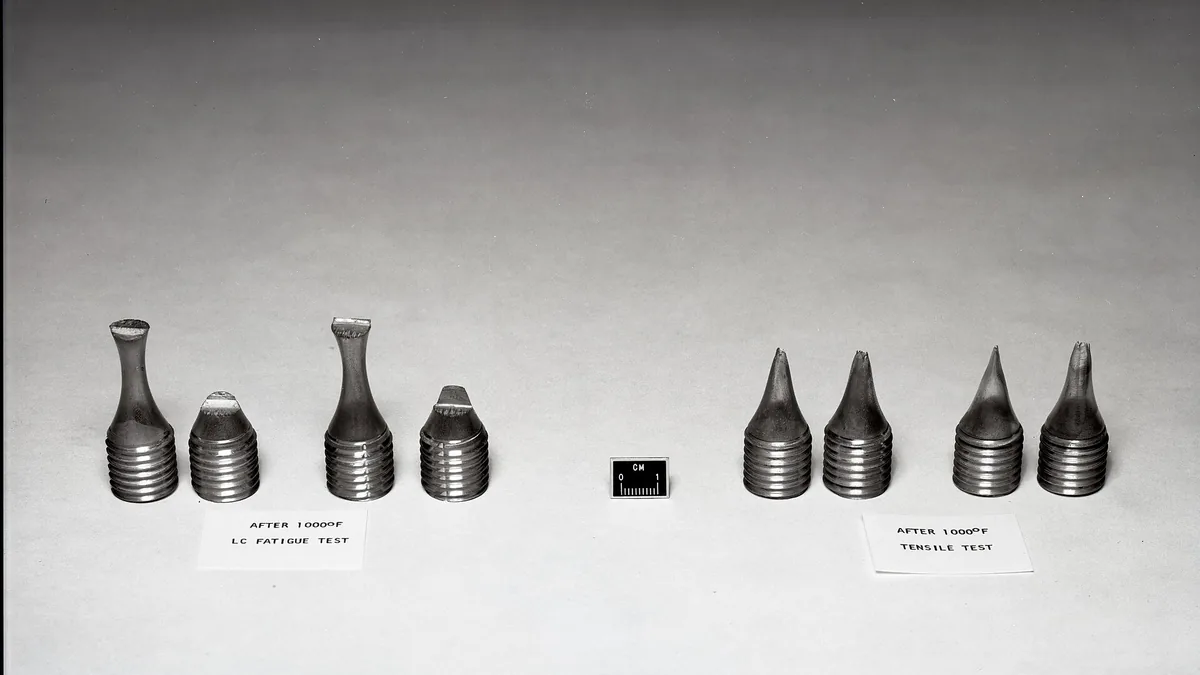

Engineering stress and true stress are two distinct measures of how a material carries load during a tensile test. Engineering stress uses the original cross-sectional area for all calculations, making it simple and standardized for quality control. True stress accounts for the instantaneous area reduction as the specimen stretches and necks, providing the actual stress state the material experiences. The choice between them depends on whether you need a repeatable specification check or accurate input for nonlinear finite element analysis and forming simulations.
What is engineering stress and strain?#
Engineering stress is the applied force divided by the original cross-sectional area of a tensile specimen. Engineering strain is the change in gauge length divided by the original gauge length. These measures assume constant area and are used for material certification and quality control because they are simple to calculate from standard tensile tests.
Engineering stress, often denoted as σₑ or simply S, is calculated by dividing the applied force F by the original cross-sectional area A₀ of the tensile specimen.
σₑ = F / A₀
Engineering strain, denoted as e or εₑ, is the change in length divided by the original gauge length L₀.
e = (L - L₀) / L₀ = ΔL / L₀
These formulas assume that the cross-sectional area remains constant throughout the test. For the elastic region and a portion of the plastic region before necking, this assumption is reasonable because the area reduction is small and uniform along the gauge length. However, once necking begins, the cross-section at the neck decreases rapidly and non-uniformly. The engineering stress curve continues to use A₀, so it reports a lower stress than the material actually experiences at the neck.
What is true stress and strain?#
True stress is the applied force divided by the instantaneous cross-sectional area of a tensile specimen. True strain is the natural logarithm of the ratio of current length to original length. These measures account for area reduction and provide the actual stress state, making them essential for nonlinear FEA and forming simulations.
True stress, denoted as σₜ, uses the instantaneous cross-sectional area Aᵢ at the point of measurement.
σₜ = F / Aᵢ
True strain, denoted as εₜ, integrates the incremental strain over the entire deformation history.
εₜ = ln(L / L₀) = ln(1 + e)
For a material that deforms at constant volume (a valid assumption for most metals in the plastic range), the relationship A₀L₀ = AᵢL holds. This allows true stress to be expressed in terms of engineering stress and strain up to the onset of necking.
σₜ = σₑ (1 + e)
These conversion formulas are valid only while deformation is uniform along the gauge length. Once necking starts, strain localizes and the simple volume-constancy relationship no longer applies across the entire gauge section. At that point, true stress must be calculated from direct measurements of the neck profile or diameter.
What is the necking correction for true stress?#
The necking correction adjusts true stress calculations after a tensile specimen begins to neck, accounting for the triaxial stress state that develops. For round specimens, the Bridgman correction is the most common method. For sheet specimens, digital image correlation or empirical methods are used because the Bridgman correction does not apply directly.
Bridgman Correction for Round Specimens#
For round tensile specimens, the most widely used method to correct true stress after necking is the Bridgman correction. It accounts for the triaxial stress state that develops within the neck. The neck acts as a notch, creating radial and circumferential stresses in addition to the axial stress. This constraint raises the apparent axial stress required to continue plastic flow.
The Bridgman correction factor is:
σₜ_corrected = σₜ_uncorrected / [(1 + 2R/a) * ln(1 + a/2R)]
Where:
- a is the minimum radius of the specimen at the neck
- R is the radius of curvature of the neck profile
Measuring a and R requires either continuous digital imaging during the test or post-test profilometry of the fractured specimen. Some modern testing systems use laser extensometers that track the diameter at the neck in real time, allowing direct calculation of Aᵢ without assuming constant volume.
Sheet Specimens#
For flat sheet specimens, the necking geometry is more complex because the width and thickness do not reduce proportionally. The Bridgman correction does not apply directly. Instead, methods such as digital image correlation (DIC) track the full strain field, or empirical corrections based on the ratio of width to thickness are applied. ASTM E646 addresses true stress-strain determination for sheet materials and provides guidance on handling diffuse and localized necking.
When should I use engineering stress instead of true stress?#
Use engineering stress-strain for quality control, material certification to ASTM E8, and small-strain linear FEA. Use true stress-strain for nonlinear FEA with large plastic strains, metal forming simulations, and ductile fracture analysis. The choice depends on whether the analysis involves necking or strains beyond uniform elongation.
Use Engineering Stress-Strain When:#
- Performing quality control and material certification to ASTM E8, ASTM A370 or ISO 6892-1
- Comparing yield strength, UTS and elongation values against material specifications
- Selecting materials from supplier datasheets, which almost universally report engineering values
- Running elastic or small-strain linear FEA where plastic strains remain below a few percent
- Communicating with procurement teams and fabricators who work with specification limits
Use True Stress-Strain When:#
- Building plasticity models for FEA that will see strains beyond uniform elongation
- Performing metal forming simulations (stamping, forging, extrusion, bending) where necking or large plastic strains occur
- Conducting ductile fracture analysis using damage models such as Johnson-Cook or Gurson-Tvergaard-Needleman
- Calibrating hardening curves for software like Abaqus, ANSYS or LS-DYNA that require true stress vs. plastic strain input
- Analyzing post-necking behavior for crashworthiness or collapse simulations
A common mistake is to input the engineering stress-strain curve directly into FEA software that expects true stress-strain data. This leads to an under-prediction of hardening at large strains and can result in non-conservative designs.


How do engineering stress-strain and true stress-strain compare?#
Engineering stress-strain uses original area and is simpler to measure, but it underestimates stress after necking. True stress-strain uses instantaneous area and continues to rise until fracture. The table below summarizes the key differences in area basis, formulas, peak stress behavior, measurement complexity, standards, and typical applications.
| Aspect | Engineering Stress-Strain | True Stress-Strain |
|---|---|---|
| Area basis | Original area A₀ | Instantaneous area Aᵢ |
| Stress formula | σₑ = F / A₀ | σₜ = F / Aᵢ |
| Strain formula | e = ΔL / L₀ | εₜ = ln(1 + e) |
| Peak stress point | Ultimate tensile strength (UTS) | No peak; rises until fracture |
| Post-necking behavior | Drops after UTS | Continues to increase |
| Measurement complexity | Simple; requires only force and extension | Requires diameter or neck profile measurement |
| Primary standards | ASTM E8, ASTM A370, ISO 6892-1 | ASTM E646, ISO 10275 |
| Typical reporting | Material test reports, certifications | Research, FEA input, forming limit diagrams |
| Software input | Elastic or small-strain analysis | Plasticity and large-strain FEA |
| Constant volume assumption | Not required | Required for pre-necking conversion; not valid post-necking |
How do you calculate true stress from tensile test data?#
To calculate true stress from a tensile test, use σₜ = σₑ(1+e) up to the ultimate tensile strength, assuming constant volume. After necking, measure the minimum diameter and apply a necking correction such as Bridgman. The worked example below illustrates the conversion for a hot-rolled steel round specimen at uniform deformation, at UTS, and just before fracture.
Uniform Deformation Region (Before Necking)#
At a point during the uniform elongation region, the applied force is 52 kN and the extensometer reads an extension of 7.5 mm.
Engineering stress: σₑ = 52,000 N / 122.72 mm² = 423.7 MPa
Engineering strain: e = 7.5 mm / 50 mm = 0.15 (15%)
True stress (constant volume assumption): σₜ = σₑ (1 + e) = 423.7 × 1.15 = 487.3 MPa
True strain: εₜ = ln(1 + 0.15) = ln(1.15) = 0.1398 (13.98%)
At this stage, the true stress is approximately 15% higher than the engineering stress, matching the (1 + e) multiplier.
At Ultimate Tensile Strength#
The maximum force recorded is 68.5 kN. The specimen has elongated uniformly to 11.5 mm extension at UTS.
Engineering UTS: σₑ_UTS = 68,500 N / 122.72 mm² = 558.2 MPa
Engineering strain at UTS: e_UTS = 11.5 mm / 50 mm = 0.23 (23%)
True stress at UTS: σₜ_UTS = 558.2 × 1.23 = 686.6 MPa
Post-Necking (Just Before Fracture)#
Just before fracture, the load has dropped to 48 kN. The minimum diameter at the neck measures 7.8 mm, giving an instantaneous area Aᵢ = π(7.8/2)² = 47.78 mm².
Engineering stress at fracture (still using A₀): σₑ_fracture = 48,000 N / 122.72 mm² = 391.1 MPa
True stress at fracture (using Aᵢ): σₜ_fracture = 48,000 N / 47.78 mm² = 1004.6 MPa
Without the Bridgman correction, this is the uncorrected true fracture stress. The corrected value would be lower because the triaxial constraint at the neck artificially elevates the axial stress. If the neck radius of curvature R is measured at 5.2 mm and the minimum radius a is 3.9 mm, the Bridgman factor is:
Correction factor = [(1 + 2×5.2/3.9) × ln(1 + 3.9/(2×5.2))] = [(1 + 2.667) × ln(1 + 0.375)] = [3.667 × ln(1.375)] = 3.667 × 0.3185 = 1.168
Corrected true fracture stress: σₜ_corrected = 1004.6 / 1.168 = 860.1 MPa
This example shows that engineering stress at fracture (391 MPa) understates the actual material stress by more than a factor of two. The corrected true stress (860 MPa) represents the real flow stress of the material at the fracture location, which is the value needed for ductile damage models.
What standards apply to engineering and true stress testing?#
ASTM E8, ASTM A370, and ISO 6892-1 govern engineering stress-strain testing for quality control. ASTM E646 and ISO 10275 address true stress-strain determination for sheet materials. For round specimens, no single international standard covers post-necking true stress; laboratories often combine ASTM E8 with direct diameter measurement.
ASTM E8 / ASTM A370 / ISO 6892-1#
These standards govern routine tensile testing for quality control and material certification. They specify the determination of engineering properties: yield strength, UTS, elongation and reduction of area. None of these standards require or produce true stress-strain curves. For a detailed walkthrough of a tensile test report, see our guide on How to Read a Tensile Test Report (Step by Step).


ASTM E646#
ASTM E646 specifically addresses the determination of true stress-strain curves for metallic sheet materials. It requires continuous or frequent-interval measurement of both force and instantaneous specimen width (or cross-sectional area). The standard provides methods for calculating true stress and true strain up to the point of maximum uniform strain, and it discusses limitations when necking occurs.
ISO 10275#
ISO 10275 covers the determination of the strain-hardening exponent (n-value) from true stress-strain data for flat metallic materials. This n-value, derived from the Hollomon equation σ = Kεⁿ, is a critical input for forming simulations and drawability assessments.
For round specimens, no single international standard mirrors ASTM E646 exactly. Laboratories typically develop in-house procedures that combine ASTM E8 testing with continuous diameter measurement using laser micrometers or video extensometers.
How do I prepare true stress-strain data for FEA input?#
To prepare true stress-strain data for FEA, extract data up to UTS, convert to true stress and true plastic strain, then extend the curve beyond UTS using necking measurements or extrapolation. Verify mesh-size sensitivity if using ductile fracture models. The steps below detail the process.
-
Extract data up to UTS: Calculate true stress and true strain from engineering data using σₜ = σₑ(1+e) and εₜ = ln(1+e). This is valid only to the UTS point.
-
Remove elastic strain: The total true strain includes elastic and plastic components. Subtract the elastic strain εₑ_elastic = σₜ / E from the total true strain to obtain true plastic strain. FEA software expects stress vs. plastic strain.
-
Extend the curve beyond UTS: If the simulation involves strains beyond uniform elongation, the post-necking true stress-strain curve must be added. Options include:
- Direct measurement with neck correction (Bridgman or DIC)
- Extrapolation using a hardening law (Hollomon, Ludwik, Voce) fitted to the pre-necking data
- Inverse FEA calibration where the curve is adjusted until the simulated load-displacement matches the experimental curve
-
Verify mesh-size sensitivity: Ductile fracture models exhibit mesh-size dependence. The post-necking hardening curve should be calibrated in conjunction with the element size used in production simulations.
For more on how mechanical testing fits into broader material characterization, see our Mechanical Testing of Metals: The Complete Guide.
What are common misconceptions about engineering vs true stress?#
Common misconceptions include that true stress is always higher than engineering stress (in compression, true stress is lower), that the simple conversion formula works post-necking (the formula is invalid after necking), that ASTM E8 provides all data for FEA (ASTM E8 covers engineering properties only), and that reduction of area equals true strain at fracture (true fracture strain is ln(A₀/A_final), not RA).
-
“True stress is always higher than engineering stress.” This is true in tension because the area decreases. In compression, the area increases, so true compressive stress is lower than engineering compressive stress at the same strain magnitude.
-
“I can just convert the entire engineering curve to true stress using σₜ = σₑ(1+e).” This formula is invalid after necking begins. Applying it post-UTS produces a curve that rises slightly then drops, which is physically incorrect. The true stress must continue to rise.
-
“ASTM E8 gives me all the data I need for FEA.” ASTM E8 provides engineering properties only. You need additional measurements and processing to generate a valid true stress-strain curve for plasticity modeling.
-
“Reduction of area is the same as true strain at fracture.” Reduction of area (RA) is calculated as (A₀ - A_final)/A₀. True strain at fracture is ln(A₀/A_final). For an RA of 60%, the true fracture strain is ln(1/(1-0.6)) = ln(2.5) = 0.916, not 0.6.
Key takeaways#
- Engineering stress uses original area and is the standard for material specifications, quality control and comparing supplier data to ASTM E8 requirements.
- True stress uses instantaneous area and is essential for FEA plasticity models, forming simulations and any analysis involving large plastic strains or necking.
- The simple conversion σₜ = σₑ(1+e) works only up to the UTS point. Post-necking true stress requires direct area measurement and a triaxiality correction such as Bridgman.
- Engineering stress at fracture can be less than half the true fracture stress, which has major implications for ductile failure predictions.
- Inputting engineering stress-strain data into FEA software that expects true stress-strain data leads to under-predicted hardening and potentially non-conservative designs.
- ASTM E646 and ISO 10275 provide the framework for true stress-strain determination, but many testing programs require supplementary procedures for post-necking data on round specimens.
Entities in this article
Frequently Asked Questions
What is the main difference between engineering stress and true stress?
Engineering stress divides applied force by the original cross-sectional area, while true stress divides force by the instantaneous area measured during the test. Once necking begins, true stress becomes significantly higher than engineering stress because the actual load-bearing area decreases rapidly.
Why does true stress continue to rise after necking when engineering stress drops?
Engineering stress drops after the ultimate tensile point because the calculation still uses the original area, which no longer represents the real load-bearing section. True stress uses the shrinking instantaneous area, which decreases faster than the load drops, so the calculated stress keeps increasing until fracture.
When should I use true stress-strain data instead of engineering data?
Use true stress-strain data when performing finite element analysis (FEA) with large plastic strains, metal forming simulations or any situation where the material undergoes necking. Engineering stress-strain data is sufficient for elastic analysis, comparing material specifications and quality control checks where strains are small and uniform.
Does ASTM E8 give me true stress values?
No. ASTM E8 specifies testing procedures and calculations for engineering stress and strain based on original dimensions. True stress-strain data requires additional measurements of instantaneous cross-section or diameter during the test, which is covered by ASTM E646 for sheet materials or by using extensometers and diameter measurement devices in round specimens.